Free the Data: FEMA’s New Data Visualization Tool

FEMA collects data from disasters. We look at various hazards over time, and a question we get a lot when we’re trying to talk about what can happen is what has happened previously?
Providing data in its raw format and also building visualization tools allows people to look at their past history, look at what kind of hazards they are vulnerable to, and look at the frequency of disaster declarations and the impacts. These are useful tools to give people context to what their past looks like when they are planning for future risk.
Not everyone is a programmer. Some people can take our raw data and manipulate it quite effectively. When I was a county emergency manager, I was a staff of one, so even if you put the data out there in its raw feeds, I really didn’t have the skills or resources to look at it.
So our strategy has two parts to it: make the data available at its lowest common denominator (which is our feeds) and then then build visualization tools around the most frequently asked questions we get.
Part of the idea of freeing the data is we don’t know what people are going to come up with, so we don’t put any boundaries on it, we ask folks to reference it back to the source, and how they manipulate it and what they do with it—we invite folks to go experiment.
If someone overlays the financial data, it becomes a heat map of devastation because the greater dollar figures are tied to the greater damages. You can also see where we have been making investment to buy down future risk, which is another way to look at a heat map of where is the concentration of funding going into and does that correspond to the hazards we’re seeing as far as previous declarations.
What I would hope would come out of this is that people have a better understanding of risk. Disasters are fortunately for many people, very infrequent. We know the least useful tool for getting ready for hurricanes or tornadoes is experience, because very few people fortunately go through it. So looking at data that we have about these events for the people who have not been through them, we can, I hope, cross the experience gap.
Visualizing the Data
You can start seeing hot spots when you look at overlays of which communities have been declared major disaster areas but then look at how much money they have received; often times if you look at the early data, all we could show you was how many counties within the state were declared in the disaster—it didn’t really tell you the impact.
It’s a very quick way to say yes, this makes sense. We see states and local government making investments in mitigation that corresponds to their history of disaster and their impacts of disaster, and if you saw funding that didn’t match that up, it would cause you to ask the question why. And there may be good reasons, but at least it gives us a chance to ask questions about why doesn’t this make sense, versus just assuming that things are going the way you would expect them to.
Our New Disaster Data Visualization Tool
As our first data visualization tool that we soft launched, it didn’t have a lot of refinement. But people were surprised by some of the states with high frequent disaster declarations and people didn’t even realize how many times their states had declarations. This gives you a way to take a lot of data at your home state to see how many times it’s been declared, and some people are surprised by how many times they have been declared or how infrequently they have been declared.
The only way you could previously get that is by going disaster by disaster (on the web) or sifting through the raw data to try to look it up.
By visualizing the data, you can point and click to explore the data without having to go through all of those previous disasters.
The visualization uses historical disaster declaration data to show you everything from seasonal risk to specific types of hazards and patterns, for both local communities and Tribal governments.
As we’ve done with disasters, we’ve maintained specific pages and information for those disasters that may not be available in that visualization tool, so we link to it. It’s important, so if you have a question about a particular disaster, like in my home state of Florida with Hurricane Andrew, you can see Andrew and you see the big dollar impacts. It’s not that there was just a hurricane called Andrew in 1992. It’s important to get the information into the hands of people, and to do it the easiest way possible.
How this tool supports local emergency management
Often, as a local emergency manager, you’re asked to go out to speak to groups and you want to be able to provide the communities the risk and what they need to do to get ready. It’s always good to have the past history, so you can get that data easily.
Particularly when talking with business groups, they want to see dollar figures and they ask how much are you talking about? Saying that you have been hit by tornadoes or hurricanes doesn’t really put it into context in dollar figures, but when you can start showing them money spent and impacts, it’s a much more powerful tool.
Either you have to do a lot of research and look in a lot of arcane places or you can use our newest visualization tool with a couple of clicks and you can adjust to see historical seasonal risk, adjust to see specific types of hazards, and you can see previous risk patterns—and that is something that is pretty powerful when you’re trying to get across preparedness and mitigation planning before disasters happen.
On the other hand, if a community has been fortunate and hasn’t had a lot of disaster activity, you can use a community that has similar characteristics and who has experienced disasters to see what it cost you. If you have a similar risk, but you may not have had that impact like other communities, we could see what the potential impacts are.
If you’re a staff of one or two people, that’s weeks of research. With our visualization tool, it’s a couple of clicks. When I was a local or state official, I think it would have been helpful to go back and look at how many times has my state been impacted by hurricanes since these program have been in existence.
How this helps with future planning
Too often I’ve hear—I’ve lived here all my life, that will never happen—until it happens.
So we need to have a better way of communicating risk and showing the vulnerability of communities. It’s looking at addressing risk from the future—from land use planning to codes to ways we can build in our environment that doesn’t grow our risk and hopefully buy down future risk. It’s ensuring we gain a better understanding of what has happened in past disasters, what those costs are, and what may be better solutions, conversely to building a system that only responds to a disaster after the fact and tries to rebuild.
Particularly in the research community, looking at architecture from land use planning to growth management policies, to look at this data to challenge our assumptions of how we build resiliency organically into community design and function, versus when a disaster happens and then we need to figure out how to do something different.
Collaborating with the Red Cross

One of the things you hear a lot about is big data. If you take all this data and put it out there, someone is going to come up with a miracle cure and find something that no one ever thought about. But there aren’t that many concrete examples of what big data has done.
We have a program with the U.S. Fire Administration called the National Fire Incident Reporting System, and over time it has collected a lot of data. One of the challenges was, once we had the data, what could we do with it and who would be interested in it. The first thing we had to do with it is make that data available because it was not easy to get to.
The Red Cross completed an evaluation of disasters and found the majority of the chapter responses in this nation were to house fires. It’s the largest, single, most active disaster response they have. People don’t really think of home fires as a disaster unless it’s your home but the Red Cross, they saw this as one of the areas that their chapters were dealing with daily.
One of the main concerns of the U.S. Fire Administrator is that we were not seeing a decrease in the loss of life in house fires. It had been pretty stable. We were still losing far too many people. And one of the pieces of information that we had that came out of all of that big data—the majority of fatalities in home fires—do not have a working smoke detector present.
There have been smoke detectors “give aways,” grants for smoke detectors, but there had never been a concerted effort to target smoke detectors based upon the data where the deaths were occurring. As a result, we were not always sure the smoke detectors went to the greatest need. Often times they went to the greatest availability, but they weren’t going to where the data said the greatest risk was.
The Red Cross said this is something they were interested in and we partnered with them, and they also partnered with volunteer organizations (to do the installations) who targeted communities based on our data, where the greatest risk was.
You can never give away enough smoke detectors to have them in every home, but you can target the high risk areas and start the process of bringing down the death toll.
The FEMA App: A Swiss Army knife of preparedness
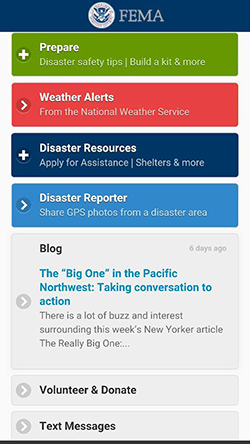
There are a lot of apps that do notifications. You can sign up for alerts from local government to alerts from various weather companies. The challenge has been marrying up an emergency alert from the weather service to corresponding action. A lot of times, when you get a tornado warning, you get that message, but then you have to go somewhere else to find out what to do.
In the new version of the FEMA App, if there a tornado warning or tornado watch from the National Weather Service, it alerts you to that, but then the FEMA App ties you back to information in your app. So if you lose connectivity or you don’t have a lot of bandwidth, it’s already in the app. It’s very simple, you have what you need to do, right now.
We did this for all of the major warning and watches from hurricanes to tornadoes to flash floods to severe thunderstorms. So when that comes up, it will not only give you the official weather service product, it also provides specific actions so you can click and know what the next steps are you need to take.
The other thing that the team did was to allow people to select up to 5 locations.
I work in Washington but I kept my home in FL, so I actually have the alerts for here and there. I can add family members in New Orleans during hurricane season. Generally I know this stuff, but it’s been interesting to me how many times I’ve seen special weather statements for severe thunderstorm warnings for my house in Florida while I’m up here working.
So if you’ve got your mom who lives somewhere, like in Naples, and you want to know what’s going on down there, because mom may not always call you when something is happening, you’ll get those weather updates, so you can call her and ask—“Hey mom, how are you doing? Are you OK? I saw there was a tornado warning.”
It’s moving from just an App that gives you basic information to something more dynamic. There are a couple of other features in there that I think as people dig into it, will find out that it’s a Swiss army knife of preparedness. We also have disaster reporter that allows people to self-report impact, and shoot pictures and send us information on what’s happening.
Often times, some of the best information is the initial reports on the ground. And we know from a lot of disasters, cell service isn’t always knocked out. Where you do have it, or if you have wifi, send us your pictures. It gives us often times a good, initial assessment of how bad things have gotten. It’s got a lot of depth to it.
Thanks for reading and click on these links to learn more about each of the items I discussed:
- Disaster Declaration Visualizations
- FEMA App
- Red Cross Home Fire Prevention CampaignThis post was originally published on the FEMA blog by Craig Fugate, FEMA Administrator.