Digital Metrics for Federal Agencies

Digital metrics are critical for measuring, analyzing, and reporting on the effectiveness of your Web, mobile, social media, and other digital channels. Every agency should have a metrics strategy to measure performance, customer satisfaction, and engagement, and use the data to make continuous improvements to serve its customers.
- Part 1: Common Metrics: Guidance, Best Practices, and Tools
- Part 2: Reporting Requirements and Common Tools
- Part 3: Rationale and Framework for Common Metrics and Measures
- Part 4: Case Studies, Training, and Additional Resources
Part 1: Common Metrics—Guidance, Best Practices, and Tools
Agencies should ensure that they collect, analyze, and report on a minimum baseline set of performance and customer satisfaction measures. It’s important to collect a variety of metrics—not just visits or page views—to get a holistic picture of how well you’re delivering your digital services and information. While a goal of the Digital Strategy is to have a common set of performance measures and consistent means of collecting data, agencies may have varied approaches to using and interpreting the data based on individual agency and website goals.
Adopting a common set of baseline measures and tools across all federal executive branch agencies has many benefits, including providing an unprecedented, government-wide view of how well agencies serve their customers.
Guidance on common metrics is divided into the following sections, which describe what you should measure, what to do with the data, and common tools to help you collect and analyze your metrics:
- Web performance
- Customer satisfaction
- Search
- Usability
- Mobile
- Social media
Web Performance Metrics
Web performance metrics tell you how well your website and other digital services are performing, and are generally derived from tools that measure usage, traffic, site quality, and performance.
What to Collect
Milestone 8.1 of the Digital Government Strategy calls for GSA’s Center for Digital Services Innovation Center to develop guidance on common performance metrics. The following guidance was derived from extensive research of common practices in industry and government and recommendations from the Federal Web Metrics Community of Practice.
Below are ten minimum common baseline performance metrics that agencies should collect for their .gov websites. They will help you measure different elements of performance, such as how many people are visiting your websites, how much time they’re spending on your site, how often they return, etc.
Minimum Common Baseline Performance Metrics
| Metric | Definition | How to Use It | Benefits and Considerations |
|---|---|---|---|
| Total Visits | Visit is an interaction by an individual viewing one or more pages on your website. | Provides high-level information on the breadth of traffic to a given digital service. | Most universal, fundamental, and accurate way to measure volume of traffic. Also most popular and widely reported metric for cross-comparing traffic from various websites. Most common question about your website traffic is, “How many visits does your website get a day or month?” Tracked over time, total visits create a historical trend of your website traffic and a baseline that can be used to compare against future traffic patterns and changes. Caveat is that total visits is sometimes confused with number of unique individuals who use your site (data that can only be measured by unique visitors). |
| Total Page Views | Page view is number of times a page was viewed during the designated time period (e.g., monthly). | Provides high-level information on the breadth of content usage of a given digital service. | Invaluable for measuring overall volume and how much content people use on your website. Can give you a number of “eye balls” for your content at a high-level. This metric is also universal and cross-comparable with other websites. |
| Unique Visitors | Unique visit is one person (or a computer/IP address) who visits your website at least once during a designated time period (e.g., monthly). | Provides high-level information on the breadth of traffic to and content usage of a given digital service. | Powerful, invaluable metric because it’s the only measure that accurately calculates how many individual people (or physical computers) actually visited your website in a given time. Combined with total visits, it can tell a comprehensive story about your customers and their visit patterns. Gives you unique “universe” or population of visitors vs. aggregate totals.Agencies need to follow OMB guidance on using persistent cookies with online performance and customer satisfaction tools. |
| Page Views per Visit | Number of page views in a reporting period divided by number of visits in the same reporting period. | Measures depth of a visit and level of engagement. | Very important for understanding engagement level of a visit. However, because there are different types of websites (e.g., transactional, navigational, directional, etc.), this metric should be used and interpreted within the context of each website’s goals. For example, a directional website’s goal may be to send its visitor from point A to point B, and point B happens to be a different website. In that case, you may only have one page per visit as your desired average. In other cases, a website’s goal may be to provide a high volume of content (multiple page views) within the same website. In any of these cases, this metric will help determine if the website is doing its job by providing the desired number of pages per visit. |
| Average Visit Duration | Length of time in a session (activity on a website during a specified time period). | Measures extent of a visit. | Tells you how long your visitors stay on your website. Should be interpreted based on each website’s goals. For example, is your website’s goal to get your customers the information they need in the least amount of time? Or send them to a different website? Or, are you trying to engage them with your website content so that they stay on the website as long as possible? This metric will help you determine if your website is meeting those goals. |
| Time on Page | Time visitors spend on individual pages. | Measures extent of a visit. | Critical for measuring effectiveness of specific pages (e.g., content campaigns, transactional pages, etc.) that carry a specific purpose. For example, your website is launching an awareness campaign by placing key content on your website’s home page. Because visitors can view multiple pages within the same visit (e.g., home page and others), you’ll need to know how much time was devoted to each visited page to measure each page’s effectiveness. |
| Bounce Rate | Percentage of visitors who looked at only one page and immediately left the site. | Measures depth and quality of a visit. | Measures percentage of people who come to your website and leave instantly. Invaluable metric to determine if your website is doing a great job (e.g., for directional sites, you may be looking for a high bounce rate because you want to direct visitors off to an external site), or a poor job (e.g., for content-heavy sites, if the bounce rate is high, the website may not be appealing, interesting or have other issues that make visitors leave without trying another page). |
| New vs. Returned Visitor | Ratio between first-ever site visitors to returning visitors, a User that Visited the site prior to the reporting period. | Measures visitor loyalty and site stickiness. | Derived from “unique visitors” and used within a set time frame to compare new visitors vs. returned. Depending on your website’s goals, you always want to measure and differentiate between those two types of visitors. Will help you understand if your website is attracting the same audience on a consistent basis, driving new visitors to the site, or a balance of both. Especially valuable when trying to expand reach to different types of audiences with varied interests from various locations. Note: Requires tracking unique visitors, as described above. |
| Visits per Visitor for a given time frame | Number of times a Visitor visited your website during the designated time period (e.g., monthly). | Measures visitor loyalty and site stickiness. | Derived metric that uses “Unique Visitors” and “Total Visits.” Important for determining how “sticky” your website is and whether your content is compelling enough. Regardless of your website goals, you probably want visitors to come to your website more than once. Allows you to track and trend average visits per visitor against a set time frame, identifying the time(s) when your visitors tend to come back more or less often. Can be used to track content releases and campaigns to determine what factors contribute to more frequent visits per visitor. |
| Total Number of On–Site Search Queries | Total number of times site search was used. | Extent to which a visitor uses the site’s search engine. | Good indicator of visitor behavior patterns and ease of finding content. Heavy use of an on-site search engine could mean visitors are unable to quickly find content they expected to find when they first landed on your site. Or, could mean visitors don’t want to read through content and would rather skip to search box to find specific information. In contrast, low number of search queries may mean content is readily available and complete. This metric will help determine if any of those scenarios apply to your website. |
Definitions above are derived from the Web Analytics Association’s Definitions of Common Metrics Terms (PDF, 111 KB, 34 pages, January 2008)
How to Collect and Analyze the Data
Below are a set of recommendations to help you collect and analyze the common Web performance metrics.
1. Analyze data across various Web Dimensions. While having the core common Web metrics is the foundation for measuring digital services’ performance, the true insights come from being able to slice and dice the data across various Web dimensions. Agencies should use dimensions, such as time, content, marketing, and demographics with the common baseline Web metrics to gather crucial specifics that will give a comprehensive and holistic picture of how your website is performing and where you need to make improvements.
This is the break-down of recommended dimensions and the types of insights each of them would add to your Web metrics reports:
-
Time (Day/24 hours, week, month, year)
-
Content (Pages, downloaded files, offsite links, on-site search queries, RSS feeds)
-
Marketing (Referring domains/sites/pages, referring search keywords/phrases)
-
Technology (Browser – Web/mobile, browser – version, platform, mobile devices, screen size)
-
Demographics (Network/ISP/organization, country, state/local, city). A major caveat for the Web analytics Demographics dimension is that most Web analytics solutions are limited to the demographic information derived from an IP address of visitors computer and the network they use. Hence, the traditional, commonly associated with demographics visitor information, such as age, gender, Internet preferences etc., are not typically available via those solutions. To address the need for having the more specific customer-centric demographics, the recommended option is to use panel-based or ISP-based third-party solutions that provide website-specific and comparative analysis of websites across Federal Government Internet category (e.g., usa.gov vs. whitehouse.gov) as well as cross Internet category (e.g., irs.gov vs. yahoo.com).
The use of these five Web dimensions will allow for insightful, sophisticated reporting and research to answer such common questions, as:
- How many of our site visits came from the U.S. vs. internationally? Via a mobile device using a search engine?
- How many visits and page views came from .gov domains vs. commercial sites in the last 12 months?
- What are the top X offsite pages that visitors go to after leaving our website?
- What are our top on-site search queries? Do they contain any content that our website lacks or is hard to find?
- Are our top X pages different for visitors accessing the site from Web browsers (e.g., Internet Explorer, Firefox) vs. mobile browsers?
- Where/what U.S. location (state/city) are the most/least frequent visitors coming from?
- When (what days or months) does our website have highs and lows in traffic (e.g., visits)? Are those traffic changes driven by content releases or seasonality (e.g., summer, tax preparation time, etc.)?
- What are the most popular search terms from our top referring search engines? Are those terms/phrases closely tied to the name of the website or do visitors find our website by searching the types of services or information that the website provides?
2. Use a variety of data to tell a complete story. The intent of measuring isn’t to collect a bunch of isolated, raw data. The purpose is to collect a diverse set of data that is analyzed holistically and where someone makes connections to tell a complete story about how people are using and engaging with your website or other digital channel.
3. Focus on making continuous improvements. The ultimate goal is to drive a continual improvement of the online experience for your customers. Experts call these “actionable metrics,” as described in this Web Analytics presentation and web analytics blog. Use the metrics you gather to make targeted, data-driven improvements to your site, and track changes you’ve made to measure levels of success. In essence, you’re listening to your customers, and you’re making improvements based on what you hear.
4. Use the data to prioritize resource needs and improvements. In addition to measuring performance and satisfaction, metrics such as total page views will help you identify which content is most heavily used by your customers. This can be used to identify your customers’ top tasks so you can prioritize making improvements to that content first. In many cases, websites follow a “long tail” pattern, where a few of the most popular webpages garner the most website traffic. If this is the case with your website, you can make improvements to that content first, which may give you the biggest return on investment and impact on overall customer experience.
5. Be careful not to misinterpret the data. Always be prepared to do a deeper dive and ask critical questions so you don’t inadvertently misinterpret your data. For example, you may think that having a longer average time on site is good because it means people are spending more time on your site and are more engaged. But the flip side could actually be true—people may be spending longer because they can’t find what they need. In this case, you may want to identify your most visited pages to see what is a reasonable amount of time people should spend on those pages and see if that aligns with the actual data. You may also need to look at customer satisfaction data for that content, bounce rates, etc. This is why it’s important to look at a variety of metrics.
6. Provide context. To minimize the chance for misinterpretation of this data, you’re encouraged to “tell your digital metrics story” on your /digitalstrategy page. Provide background or supporting information to help your readers understand what this data means for your agency, beyond just numbers. For example, key measures for a Web portal may be different from an informational site, so take the opportunity to explain how.
7. Set performance targets and make sure they align with agency and business goals. Setting performance targets will give you defined goals that align with your agency mission and particular business objectives. You can identify targets based on prevailing practices from government or industry, or you can set goals to improve a particular metric over time. For example, you could set a goal to achieve a particular bounce rate, knowing that the average bounce rate for websites is 50%, according to Inc.com. Given this information, there might be cause for concern if you have a higher than average bounce rate or if your bounce rate continues to increase (unless of course, you determine that a high bounce rate is good, as may be the case with a link portal site). In this scenario, you’d want to look at other metrics to get a complete picture and identify ways to improve the content and better engage your customers.
8. Measure what matters to your customers. Keep in mind that people may use government websites specifically (when filing tax returns, to get a form), periodically (travel advisories abroad), or continuously (weather site). Depending on your site’s purpose and goals, some measures may be more important and better indicators of success. For example, when looking at average visits per visitor, the expectations of what is good or bad may vary widely by business model, as explained by Web Analytics Demystified. If you have a customer support type website, having a low average visits per visitor may be good since it could suggest that people don’t need to have multiple visits because they’re quickly satisfied with your service or they’re able to quickly resolve problems via other customer service channels (i.e., phone, in-person). But having a high visit per visitor may be good for a website whose primary purpose is a marketing campaign where you’re looking for many people to return often to your site and engage regularly.
9. Create compelling reports that turn data into action. Learn how to present your data in ways that clearly convey key messages for decision-makers and those creating your digital content.
Use the Chart Chooser tool at Juice Analytics to help you find the right chart or graph to illustrate your data.
10. Stay informed with industry research and expert reviews. The metrics landscape is vast and there’s a lot to learn. Check out reviews and blogs such as Occam’s Razor, which explains the complexities of Web analytics in a simple, easy-to-understand way. Sample relevant articles include Web Analytics Success Measurement For Government Websites; Getting Started With Web Analytics: Step One—Glean Macro Insights; and Beginner’s Guide to Web Data Analysis: Ten Steps To Love & Success.
Also, stay informed of advances in metrics and measurement by following organizations such as the Pew Research Center’s Internet & American Life Project, which researches the evolution of the Internet and its impact on American society; they have lots of great data on how people use the Web, social media, and mobile. Review white papers, online books, and case studies from IBM Business Analytics for Government, or Web Analytics Demystified.

Customer Satisfaction Metrics
Milestone 8.1 of the Digital Government Strategy calls for GSA’s Center for Digital Services Innovation Center to develop guidance on common customer satisfaction metrics. The following guidance was derived from extensive research of common practices in industry and government and input from the Federal Web Metrics Community of Practice and Federal Web Managers Council.
Below are minimum common baseline customer satisfaction metrics that agencies should collect for their .gov websites. They will tell you how people perceive the information and services you provide, and are generally derived from surveys or other direct interactions with your customers. As part of an effective Customer Service Strategy, you should collect, analyze, and act upon customer feedback in coordination with performance metrics.
Note that the four baseline metrics below are considered “beta.” Working through agencies, the effectiveness of the measures and questions will be evaluated in the next six months with an eye to developing a strong set of common satisfaction metrics across government.
What to Measure
| Metric | Definition | Ways to Use This Metric | Benefits |
|---|---|---|---|
| Overall customer experience | Customer’s perception of the experience of their visit. | Used to baseline and benchmark scores from month-to-month or year-to-year. Some tools allow for comparisons across agencies. | Very useful as overall benchmark. However, overall experience can be influenced (negatively or positively) by how someone feels overall about your organization. |
| Completion rate of intended task | The customer’s perceived ability to get the information or service they came to accomplish. | Very actionable data that gives accurate picture of whether people could successfully complete their task. Determines needs of the customer, and gaps and deficiencies in services and information. | Useful to compare with actual performance data. Some tools allow for integration between performance and customer satisfaction metrics. |
| Percent of visitors likely to return | A customer’s perceived willingness to choose your service for the same or similar task in the future. | Gauges adoption & loyalty. | Important to pair this “intention” with actual returning visitor data to make better predictions about your customers. |
| Percent of visitors likely to recommend | A customer’s perceived willingness to recommend your product or service. | Gauges adoption & loyalty. | Important to pair this “intention” with increase in new visitor data to make better predictions about your customers. |
Other measures to consider:
- Ease of getting information or using your service
- Timeliness of getting the information
- Does the information meet and/or exceed expectations
- Relevancy and usefulness of the information
How to Collect
Customer Satisfaction Survey Questions
To help you collect the common customer satisfaction metrics above, the following are recommended questions to ask via online customer satisfaction surveys. These questions are based on extensive research from Forrester, Gartner, other industry practices, and a review of what agencies are already doing to measure customer satisfaction.
- How would you rate your overall experience today? (Scale of 1-5 or 1-10)
- Were you able to complete the purpose of your visit? (Yes or No — if not, why not?)
- Would you still return to this website if you could get this information or service from another source? (Yes or No)
- Will you recommend this website to a friend or colleague? (Yes or No)
Additionally, these are questions that some agencies have used to gather related insights on customer satisfaction:
- Was the information easy to understand?
- Was the information useful?
- Was the experience enjoyable?
- Was it easy for you to find what you were looking for?
- Is this service being delivered in a reasonable amount of time? [Yes/No]
- Did you get useful information beyond what you were looking for?
- Did the interaction with this organization meet your needs?
Survey Methodology
To assess the validity of the data and provide context, agencies should also consider collecting data on the survey methodology and response rates:
- Number of surveys delivered
- Number of completed surveys
- Completion rate (percentage)
- Survey delivery methodology (e.g., completed at the end of the visit, served up after third click)
Strategies for Analyzing Customer Satisfaction Data
The Customer Experience model recommends three steps for Collecting Customer Feedback:
-
Define your goals. Establish benchmarks to help your agency set customer performance goals and service standards, typically by either comparison with internal benchmarks, or with other agencies, organizations, or functions.
-
Determine how you’ll collect customer feedback. Although many agencies will use an online survey to collect customer satisfaction metrics, as described above, there are many ways to collect customer satisfaction data. Also, while many agencies will collect metrics at the aggregate website-level, some agencies have taken a deeper dive to collect satisfaction data at the page-level or for a specific task or application, which can be highly valuable. Agencies that are already collecting customer satisfaction data at a more granular level, are encouraged to look for ways to aggregate data and also report it at the site-wide level so it can be compared with other federal sites.
-
Take action on your findings. Baseline and benchmark—agencies can take the data and create a baseline of customer perception and benchmark from year-to-year or month-to-month to show improvements in overall experience or increased ability to complete purpose of the customers visit. Look for trends and create an action plan.
Search Metrics
Search is the largest driver of traffic to government content, so it’s critical to publish content that is “findable” by search engines. Agencies should collect and analyze the following search data to help measure performance and customer satisfaction. See best practices for search engine optimization (SEO).
What to Collect
| Measure | Definition | How to Use It |
|---|---|---|
| External Search | ||
| Top referring commercial search engines | The search engines (e.g., Google, Bing, Yahoo) that send the most traffic to your site | Use their webmaster tools to optimize your site for these search engines, to make your content easier to find. |
| Top referring search terms | The most-used words and phrases people type into commercial search engines to find your content | Verify that you’re using the words of your customers (not bureaucratic, organizational jargon). Use their terminology in page titles, page content, keywords, and metadata to help your readers and improve SEO. |
| Top referring search terms with low Click Through Rates (CTR) | The most common links followed for specific search terms that don’t lead to clicks on your website | Review and update any content related to these search terms to make content more compelling and useful. |
| Internal/Site Search | ||
| Top search terms/phrases | The most-used words and phrases people type into your site’s search box | Create new content or update existing content to incorporate the “words of your customers” in your metadata and content so searchers can find the right information |
| Top “no results” queries | Most popular, valid searches that don’t return any results on your site’s search results page (e.g., because you don’t have the content on your site, or the content isn’t findable by the person’s search term) | Review your content to see if you need to add new content, or update existing content to include the words your readers search for |
| Top searches with low Click Through Rates (CTR) | Most popular search terms that people generally don’t act (click) on | Incorporate language from these popular search terms into page titles or descriptions, to encourage searchers to click on your relevant page |
| Top changing search terms (movement up/down) | Shows trending topics, what’s hot or not | Investigate why people might be losing interest in once-popular content and consider archiving if it’s no longer needed. For newly popular terms, create new content or update existing content to ensure it’s current, accurate, and complete |
| Percentage of visitors using site search | Percentage of people who visited your site and used the search box on your site | Focus on both search and navigation to help visitors find information, improve your information architecture, and make popular content more visible from entry pages |
| Top clicked URLs for specific queries | Most common results that searchers found most relevant or appealing, for specific search terms | Review these popular pages and other customer top tasks to make sure they are current, accurate, complete and compelling |
| Speed | ||
| Page load time | How quickly pages (including your search results page) load on your site | Speed is even more important than relevance in terms of whether people engage or abandon search. If pages take a long time to load, search engines won’t crawl them, and users will abandon your site. Make sure your site is optimized to load pages as fast as possible. |
How to Collect
To collect search metrics, you’ll need to pull data from a variety of sources:
1. Register for the commercial search engines’ webmaster tools
2. Collect site search analytics. Many site search tools provide analytics as part of their package. Some tools require additional development to publish the data in a readable format for Web managers. Others provide easy-to-use Web interfaces that provide reports on top search terms, click through rates, etc.
3. Collect Web analytics. Analytics products provide data on visits, bounce rates, etc. (as noted above)
4. Register for application monitoring tools (optional). Many tools are free for limited use. Use to report on site health metrics such as outages, page load times, application responsiveness, etc. (Examples: YSlow, Pingdom, AlertSite)
5. Attend training. The DigitalGov University training, USASearch: Enhancing Your Website’s Search, explains how the free USASearch tool can improve the search function on your government website. Another DigitalGov University training, The Science of Search: Competitive Intelligence for the Government Web Manager shows how to use the “science of search” to improve your search rankings.
Usability (User Experience) Metrics
Usability—now more commonly referred to as User Experience—is how a person feels about using a product, system or service, and how easy a product is to use. While Digital Metrics typically looks at the general behavior of groups, User Experience is important because it focuses on how individuals think and act in relation to a product or service.
Website User Experience focuses on how visitors think information should be organized on a website, what they expect to see when they click on a link, or their ability to find something. It’s important because online services (whether a tax form, an app for finding a bus route, or a phone number for complaints) should be easy to find and use.
Usability Testing
Usability testing provides an opportunity to watch real people using your product. It can give you important metrics such as how long it takes someone to complete a task, or how many clicks it takes to find something. It also gives you general feedback about design and functionality, offering invaluable insights into what you need to improve. If people can’t use your site, all the work you put into writing, coding and designing your site will be wasted, and you will fail in your mission. Usability testing routinely achieves a high return on investment by saving agencies thousands to millions of dollars on development costs.
Two common approaches to usability testing are:
- Large-scale qualitative tests include 20-100 (sometimes more) users. Usually used only by large e-commerce sites and other sizable enterprises to collect performance metrics on a user’s ability to complete tasks. Metrics include success rate, length of time, and error rate for task completion.
- Small-scale qualitative tests ideally involve 3-5 users in successive rounds of tests to observe user behavior and collect feedback on ease of use, design, etc. Qualitative user experience can also be measured by surveys or post-test evaluations such as the System Usability Scale (Word document, 54 K, 7 pages, August 2012).
Most user experience tests are small-scale qualitative, because they are cost-effective and provide good, actionable data. GSA offers small-scale testing to agencies through the DigitalGov User Experience Program, that lets agency staff observe and get trained on how to conduct simple usability tests.
In the DigitalGov University training, Usability Testing and Debriefing Best Practices, you’ll learn how to conduct a simple usability test, and conduct a debriefing session to sift through the feedback and identify fixes. Simple tests like this are a quick way to identify major problems, and give you the tools to take immediate action to improve your site.
User Experience Metrics
User Experience metrics are often diagnostic in nature and provide a practical way to identify the top problems with a particular digital service. But the testing may not give you answers on how to fix the problems. You’ll need to look at a variety of data, make iterative design improvements, and do follow-up testing to ensure that any fixes you’ve implemented have indeed improved the user experience.
There are no pre-defined standard User Experience metrics, because each website has different goals and audiences, and provides different services. Each site should develop its own system for evaluating user experience. What you collect may depend on the resources (staff, time, contractor support) available to you.
- If you have limited resources, you can observe a usability test through GSA’s DigitalGov User Experience Program, and the team may (depending on availability) be able to train you on how to conduct simple tests yourself. Once you’ve run a test, and observed the problems your users are having, you can focus on fixing the problems. After correcting problems, your Web Analytics should reflect the positive changes (e.g., more completed tasks, or lower bounce rate). You can also hire a User Experience contractor to set up a test for you, or create a usability strategy.
- If you have User Experience professionals on staff, or have the funds to hire contractors on a long-term basis, ask these experts to help you identify the best user experience metrics to collect and follow for YOUR site. You’ll also be able to do repeat, or iterative Web design and testing, to evaluate progress over time.
When to Collect User Experience Metrics
Conduct tests and collect metrics as often as you can. There are no hard and fast rules on how often you should test—it depends on budget, development cycle, content strategy, and many other factors. Ideally, you’ve considered your users throughout the entire design process, but you should do at least one usability test of your website either before, or immediately after, launch.
What differentiates usability testing from other performance metrics is that it can give you valuable baseline data before you even launch a website or other digital service. Some organizations conduct usability testing on paper or early prototypes of a website. This can give valuable insights on user expectations and performance that can be used to compare data over time and track improvements.
GSA’s DigitalGov User Experience Program recommends doing a small-scale test of your website every month, to build confidence and expertise, but this may be too much for some agencies. Keep in mind that, the more often you test, the more you will cultivate a culture supportive of usability testing. Once you have that, you can prioritize and test as often as needed.
Reporting Usability Metrics
User experience (usability) testing is extremely valuable but also time-intensive, so make sure you document your findings and metrics. Remember that most people don’t read reports, especially long ones, so catalogue the essential information and summarize the rest. Start off with a summary of the results, next document how you ran the tests and then highlight the data. Here’s a sample usability report from DigitalGov User Experience Program and one from Usability.gov (Word document, 215 K, 6 pages, August 2012).
Mobile Metrics
A centerpiece of the Digital Government Strategy, is a “mobile first” approach, where new Web products and applications are designed for mobile devices first, instead of the traditional desktop design.
Measuring mobile performance, which is a new channel for most agencies, is generally concerned with mobile websites, mobile apps, SMS, or even QR codes. The good news is that measuring for these channels is not markedly different from measuring performance for other digital services listed in the other sections of the Metrics toolkit.
The Mobile Gov Community of Practice is working to define practices in mobile measurement and they have created some mobile measurement and analytics practices on the Mobile Gov Wiki. Below we have listed some general approaches taken by agencies when measuring mobile product performance.
Mobile Web—If you have a mobile website, as covered in the “dimensions” section, your agency should collect data regarding the percentage of traffic coming in from mobile devices. The National Library of Medicine (NLM) has shared an ongoing study of how they’re measuring effectiveness and quality for their MedlinePlus mobile website. They measure their performance by asking three questions:
- Who is using MedlinePlus Mobile?
- How are they using MedlinePlus Mobile?
- Are they satisfied with their visit to MedlinePlus Mobile?
SMS—When the Center’s for Disease Control analyzed their SMS health alert pilot program, they asked users these questions regarding the program’s effectiveness, user expectations, and loyalty:
- How would you rate your overall satisfaction with CDC’s text messaging pilot?
- How likely are you to use any of the information in the text messages to improve your health?
- How likely are you to recommend CDC’s text messaging pilot to a friend?
- In your opinion, how effective are CDC’s text messages in meeting your needs?
- How often would you like to receive messages?
Native Mobile Apps—The newest of the digital services applications, agencies are still grasping with proper native performance measurement, but here are four metrics agencies are looking at to measure effectiveness.
- How many app downloads do we have this month?
- How many “active downloads” do we have this month? (A sign of regular users for your app)
- What are my customer reviews on the platform store? (i.e., “rate your app” rankings on the app store)
- How many users are downloading our app updates?
- If you agency app includes a Web page that is accessed once the app is open, what are the number of page views?
Social Media Metrics
Social media is transforming how government engages with citizens and how it delivers service. Agencies are using social media to share information and deliver service more quickly and effectively than ever before. Increasingly, these tools are also being used for predictive and sentiment analysis—using the vast amount of real-time data from these social platforms to predict emerging trends and respond to them quickly (referred to as “social data”).
Analysis of this social data is critical not just for agency communication offices—but also for program managers at every level of your organization. Social media in government increasingly requires accurate, targeted performance analysis to ensure we’re taking full advantage of these tools to deliver better service and engage with our customers.
Here are a set of recommended, baseline social media metrics, developed and maintained by an interagency working group of the Federal Social Media Community of Practice. The purpose is to establish a common, yet customizable approach to analyzing social data using the most cost-effective methods available. It provides a framework for agencies to measure the value and impact of social media in addressing agency mission and program goals. The aim is to move beyond obscure results of social media activities towards more sophisticated and more accurate assessments, leading to better informed decision-making.
Part 2: Reporting Requirements and Common Tools
Web Performance Metrics
The most efficient and consistent way for agencies to collect the common performance metrics is to add a common analytics page tag to their websites. Page tagging is now the industry standard for collecting real-time, detailed page-level performance data; it’s generally low-cost and relatively easy to implement.
GSA’s Center for Digital Services Innovation has developed this Metrics toolkit that provides the following resources for agencies, as part of the Digital Analytics Program.
Read OMB’s guidance to agencies (accessible to federal employees on the OMB MAX wiki):
- OMB guidance to agencies for Implementing Performance and Customer Satisfaction Tools
- Overall guidance on the Digital Strategy
Below is background and steps agencies can take now to prepare for this implementation.
Benefits of Common Page Tagging
- A common tag will collect the required metrics easily and at minimum cost to agencies, and provide a government-wide view of digital services.
- It will allow for data aggregation at the federal level, and provide agencies with robust analytics.
- The tag can supplement existing metrics applications, and offers a stand-alone solution for agencies who don’t currently have a metrics application in place.
How to Implement
1. Determine feasibility and resources. Start now to identify who will take the lead for your agency and the scope of the effort to implement a javascript-based tag on your .gov websites.
2. Update website policies to alert your visitors. Work with your agency Privacy Officer to give him or her a heads up that you’ll be collecting this performance data (if the data is different from what you’re already collecting). Although the baseline common metrics don’t include any personally identifiable information (PII), it’s still a good idea to alert relevant colleagues that you’ll be collecting the data and also to be prepared to update any site policies to alert your customers. OMB Memo 10-22 (June 25, 2010) explains the procedures for agencies when using tag-based analytics and will provide guidance to support the implementation. See the FCC Privacy Policy, which explains how they collect a variety of performance data.
3. Prioritize where you’ll implement the code. Determine if you can implement on all .gov websites and all webpages. If not, consider a phased approach where you implement first on high priority sites, customer top tasks, and most visited pages and be prepared to explain how you will fully implement over time.
4. Identify a method for adding code. If you have a content management system (CMS), it may be fairly straightforward to add the code to all your pages. Your CMS might have options for the automated handling of common code across all pages.
If not, you’ll need a method for adding the code in the most efficient way. Many non-CMS websites include a server-side include (SSI) to manage common elements across many pages of the domain (for example, to maintain a common header or footer). The code can be integrated into existing common elements such as those that are already in use across the site. Alternatively, you can use bulk edit operations that can be performed across large volumes of html files to insert a common snippet into a consistent location within the source code.
5. Attend training and hear what other agencies are doing. GSA will provide training in early September 2012 to help agencies learn about page tagging techniques, preparing for implementation, and how other agencies have implemented similar efforts. Check the DigitalGov University class schedule and subscribe to email alerts to receive notices about the upcoming training.
6. Embed the Javascript-based tag. Embed the tag once the common code is provided by GSA and customize as needed.
7. Do quality assurance testing. Audit your implementation to be sure your data is being collected accurately. The analytics engine will enable a ready view of the pages that are reporting traffic and allow for analysis as to which pages were missed.
Customer Satisfaction Metrics
Reporting Requirements
Read OMB’s guidance to agencies for Implementing Performance and Customer Satisfaction Tools (accessible to federal employees on the OMB MAX wiki).
Common Survey Tools
At this time GSA is not providing a central tool for measuring customer satisfaction. There are a variety of tools available to collect this data. However, any tool you choose should provide a way to report on the four common baseline customer satisfaction measures described above.
You can use one of the free customer satisfaction survey tools that has a federal-friendly terms of service agreement or an existing contract agreement with federal agencies. These tools include:
- iPerceptions—An online survey tool to measure customer satisfaction and provide Voice of the Customer data to help you improve your agency’s online customer experience.
- WebValidator—A website survey tool that answers critical questions, such as who is visiting and why, so you can measure your customers’ experiences.
- American Customer Satisfaction Index (ACSI)-ForeSee—customer satisfaction survey tool used by multiple federal agencies and organizations in the private sector. One advantage of using the ACSI is that you can compare your results to other government agencies and top commercial websites. Agencies using this tool include CDC and SSA.
- Survey Analytics—survey software that includes a full suite of tools for creating surveys, sending email invitations, and analyzing survey data.
- SurveyMonkey—online survey tool used to create and deliver surveys and analyze data.
Paperwork Reduction Act Clearance
If you’re collecting feedback from more than nine people (via an online survey, focus group, form, or another method), you must get prior OMB approval, per the Paperwork Reduction Act (PRA). The Fast Track PRA process can significantly speed up the approval process. Some tools, such as ACSI, have current PRA clearance, and your agency may have existing approval for other tools.
Part 3: Rationale and Framework for Common Metrics
Over the years, agencies have adopted many different tools, methodologies, and success metrics to measure website performance, resulting in a lack of consistent data around .gov website performance. At the end of 2011, only 10% of the major federal agencies used the same performance metrics to consistently evaluate websites agency-wide, as outlined in the 2011 State of the Federal Web Report.
To improve information and services to the public, agencies must establish standard ways to measure the success of .gov websites.
Common digital metrics and enterprise-wide performance measures offer:
- Cost savings—Central procurement of common tools will save agencies significant time and money, and ensure they have robust analytics tools to effectively measure performance.
- Adoption of industry standards—Common methodology, terminology, and tools will improve the accuracy of data across the federal Web space, making it easier to spot gaps and inaccuracies and fix them on a global scale. Adopting industry standards models the best practices of most successful large organizations.
- Better management and accountability—Publishing real-time, open and transparent data on .gov websites will lead to greater accountability and improved management of public websites, encourage agencies to consistently evaluate the success and usability of their websites, and more easily address gaps or duplications in services across the federal government.
- Improved collaboration—Agencies can more easily share best practices, training, strategies, and solutions when using similar tools and measures.
- High-level comparative analysis—Aggregating data across all federal executive branch websites will deliver precise information on the reach, growth, and impact of digital government services.
In addition, having common metrics provides these direct benefits to agencies:
- Website managers are in a better position to optimize their sites by studying content usage and onsite search behavior. Managers are able to use this data to report on the demand for services and products.
- Marketing and communication teams will be able to track and optimize their online campaigns and understand the online behaviors of our visitors.
- Executives can use this information to report on channel performance and strategically plan for the future. It will help tie metrics to agency mission achievement.
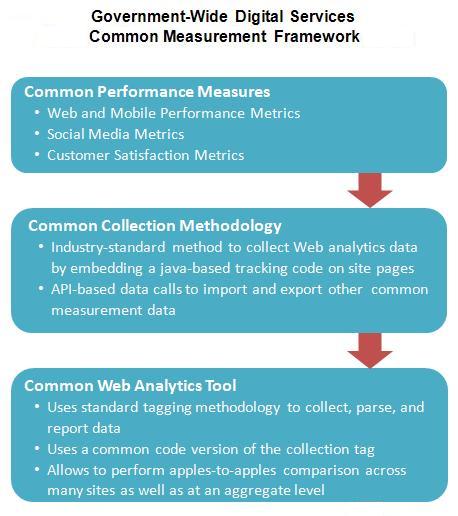
Measurement Framework
GSA’s Digital Services Innovation Center developed the Digital Services Performance Measurement Framework to identify a common approach to collect standard data, and enable aggregation of this data at the federal level.
To ensure that services are measured accurately and consistently at the federal level, as well as individually, this framework will address common government–wide:
- Metrics
- Collection methodology and tools
- Reporting interface and analysis
Key success elements will include:
- Performance measures
- Collection methodology
- Web analytics tool
The framework is based on the following types of measures:
- Breadth—standard Web analytics that provide high–level information on the breadth of traffic to, and content usage of, a given digital service
- Depth—high–level, standard Web analytics that measure the extent (time) and depth of a visit
- Loyalty—standard Web measures of visitor loyalty and site stickiness
- Direct Engagement—measures the extent to which a site visitor uses the site’s search engine (visitor must provide direct input to retrieve the desired information or action)
- Customer Experience—standard customer service measures of quality, experience, and loyalty
To support this common framework, agencies should collect performance and customer service metrics using the following types of tools:
- Performance—It is now an industry standard to use page tagging to collect real-time performance metrics, so this framework calls for the use of a common tool to collect agency performance metrics.
- Customer Satisfaction—Until an industry standard becomes apparent for collecting customer satisfaction metrics, we’re asking agencies to collect a set of four common reporting metrics, based on extensive industry research and and a review of existing agency systems. These are considered in “beta” mode while we test their usefulness during implementation.
Part 4: Case Studies, Resources, and Training
Case Studies
- CDC eHealth Metrics Dashboard—model metrics dashboard, summarizes page views, popular topics, and satisfaction scores, including Top Search Keywords, most popular pages, and mobile.
- EPA Site Statistics—guidance for EPA Web team members on how to gather and report metrics data.
- National Archives Metrics Dashboard—features selected comments from customer surveys, customer satisfaction scores, most popular search terms, website visitors, and more.
- USDA Page-Tagging Metrics Strategy—enterprise-wide implementation of a common web analytics program across all USDA agency and office websites.
- City of Boston—Web metrics dashboard provides high-level view of page visits, popular pages, search terms, and more.
Communities of Practice
- Web and New Media Community—an ad hoc group of over 3,000 federal, state, local, and tribal U.S. government employees.
- Metrics Community of Practice—part of the Federal Web Managers Council, an inter-agency group working to improve digital metrics.
- Social Media Performance Metrics working group.
Training
Get more information about training from DigitalGov University, and subscribe to get email updates on new and upcoming events.
References
Policy and Other Directives
These are federal initiatives and directives related to performance management and customer service that provide additional context and background:
- Digital Government Strategy Milestone 8.2: Links to the specific agency requirements for measuring performance and customer satisfaction measuring tools on all federal executive branch .gov websites
- Executive Order 13571—Streamlining Service Delivery and Improving Customer Service directs agencies to set standards and use customer feedback to improve the customer experience (April 2011)
- OMB M–05–04 Policies for Federal Agency Public Websites and the related OMB Circular A–130 refer to measuring satisfaction and performance
- OMB M-10-22, Guidance for Online Use of Web Measurement and Customization Technologies (PDF, 102 KB, 9 pages, June 2010)
- Paperwork Reduction Act (PRA) requires federal agencies to have OMB approval before collecting information from the public, such as from online customer satisfaction surveys.
- Fast Track PRA process streamlines PRA approval to 5 business days
- Government Performance and Results Act (GPRA) requires agencies to establish performance measures to demonstrate mission achievement
Research Bibliography
GSA developed the performance and customer satisfaction guidance with the federal Metrics Community of Practice and based on extensive research, which included the following resources:
- Reichheld, F.; Markey, R. The Ultimate Question 2.0: How Net Promoter Companies Thrive in a Customer-Driven World (Revised and Expanded Edition) (Harvard Business Review Press; September 20, 2011)
- Forrester, a global research and advisory firm:
- Bernoff, J. (June 11, 2011) Competitive Strategy In The Age of the Customer.
- Bodine, K.; and Rogowski, R. (January 14, 2011) 2011 Customer Experience Predictions.
- Burns, M. (February 17, 2011) The State of Customer Experience, 2011.
- Burns, M. (April 18, 2011) How Companies Raised Their Customer Experience Index Scores, 2011.
- Burns, M.; Manning, H., Peterson, J., and Catino, S. (December 7, 2010). The Business Impact of Customer Experience, 2010.
- Burns, M. (April 29, 2010) Three Secrets of Success for Customer Experience Organizations.
- Burns, M. (January 11, 2011) The Customer Experience Index, 2011.
- Dorsey, M. (January 28, 2010) The Future of Online Customer Experience.
- Drego, V.; Rogowski, R., and Bocal, E. (December 20, 2010) How To Craft Your Customer Research Plan.
- Evensen, R. (July 25, 2011) How To Design An Effective Voice of the Customer (VOC) Insights Program.
- Hagan, P. (April 29, 2011) Beyond CRM: Manage Customer Experiences.
- Leggett, K. (May 26, 2011) Forrester’s Best Practices Framework for Customer Service. Retrieved from www.forrester.com
- McInnes, A. (May 20, 2011) Voice of the Customer Programs Don’t Deliver Enough Value.
- Reitsma, R. (June 30, 2010) A Market Researcher’s Introduction to the Future of Online Customer Experience.
- Rogowski, R. (June 15, 2011). Why You Need A Digital Customer Experience Strategy.
- Sage, A.; Burns, M., Bocal, E., and Stone, A. (July 20, 2011) What are the Right Web Customer Experience Success Metrics.
- Gartner, Inc., an information technology research and advisory company**:**
- Alvarez, G. (March 2012) What To Do On Monday. Presented at the Gartner 360 Conference in Orlando, FL.
- Davies, J.; Thompson, E. (March 2012) Putting Plans for Customer Experience into Practice. Presented at the Gartner 360 Conference in Orlando, FL.
- Thompson, E. (March 2012) The Customer Experience Scenario. Presented at the Gartner 360 Conference in Orlando, FL.
- Thompson, E. (November 11, 2011) The Gartner Customer Experience Management Maturity Model.